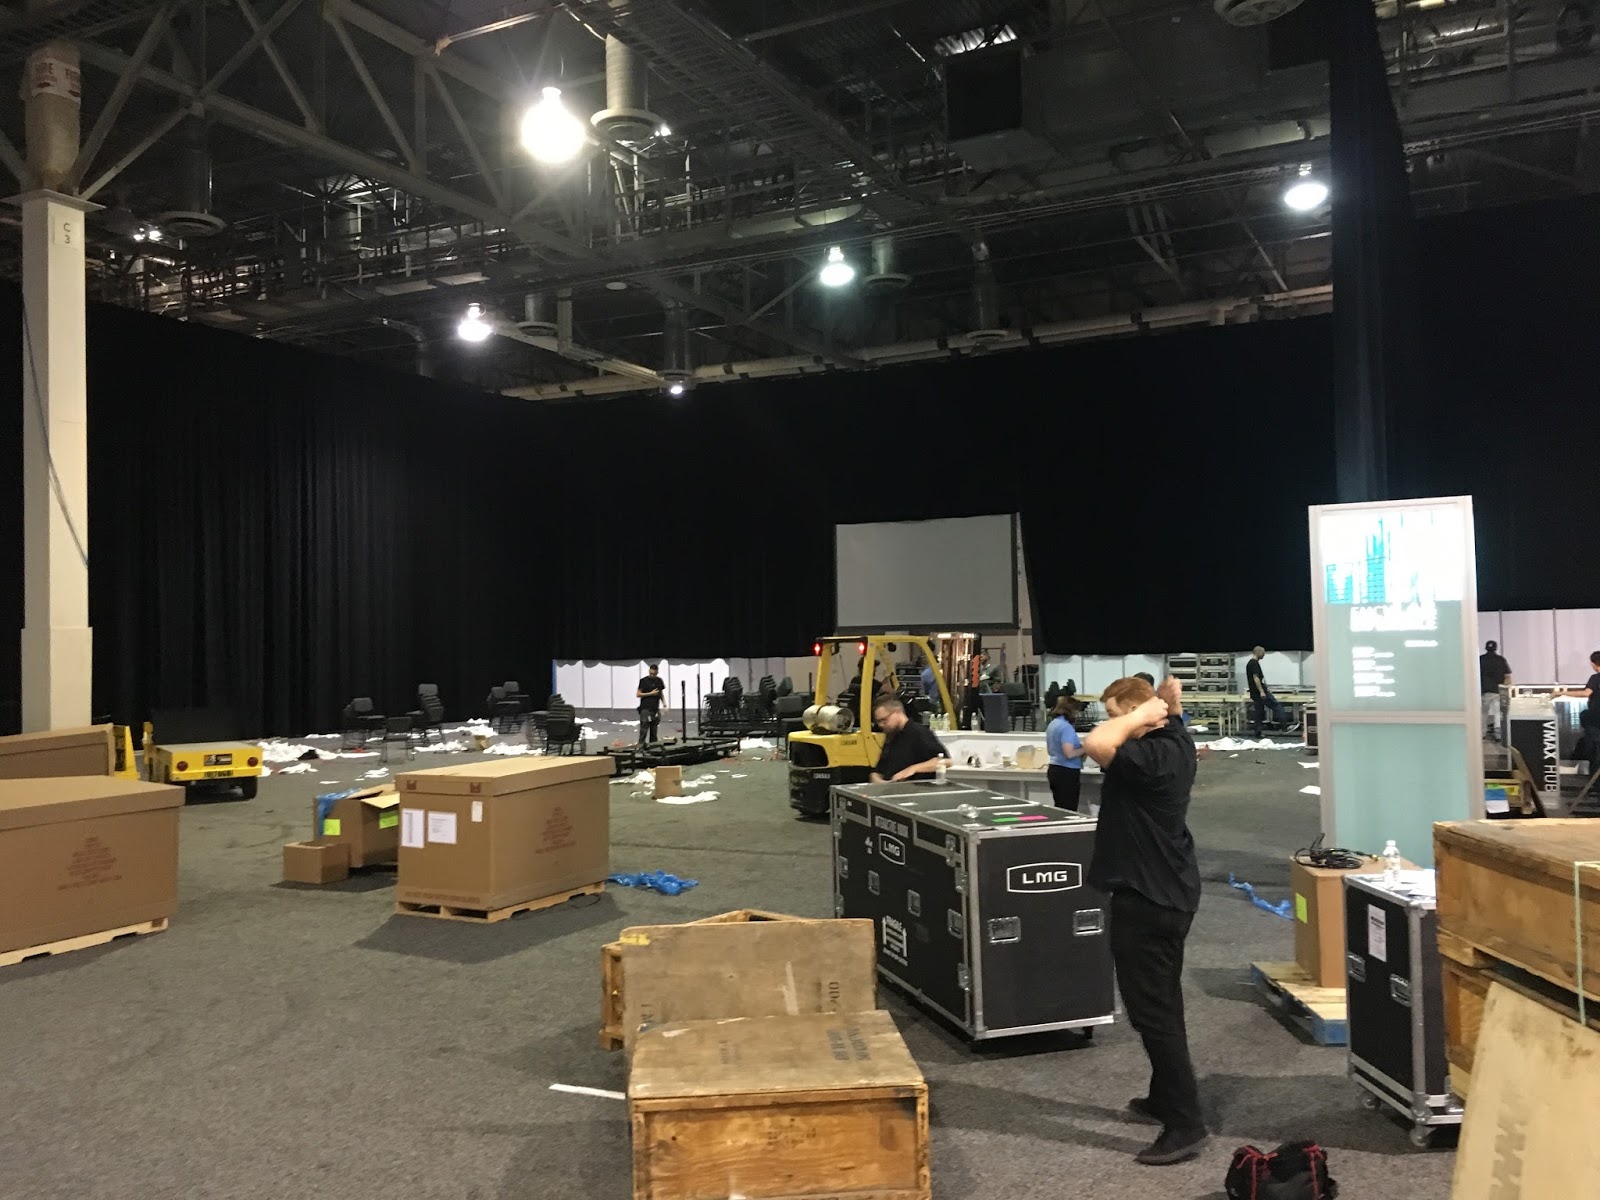
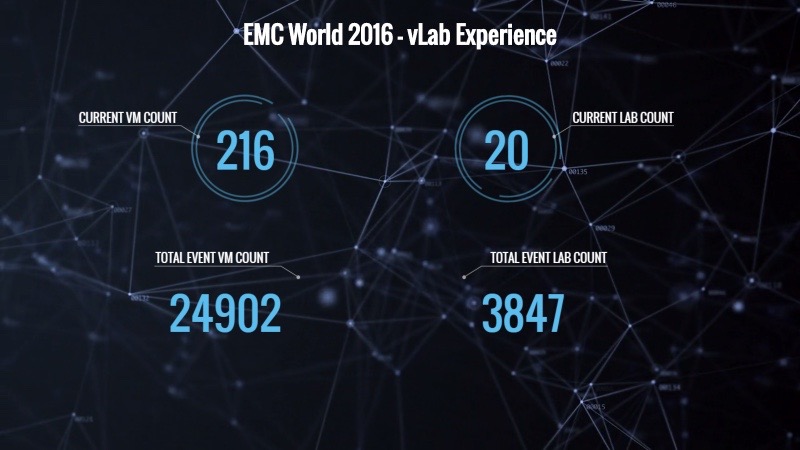
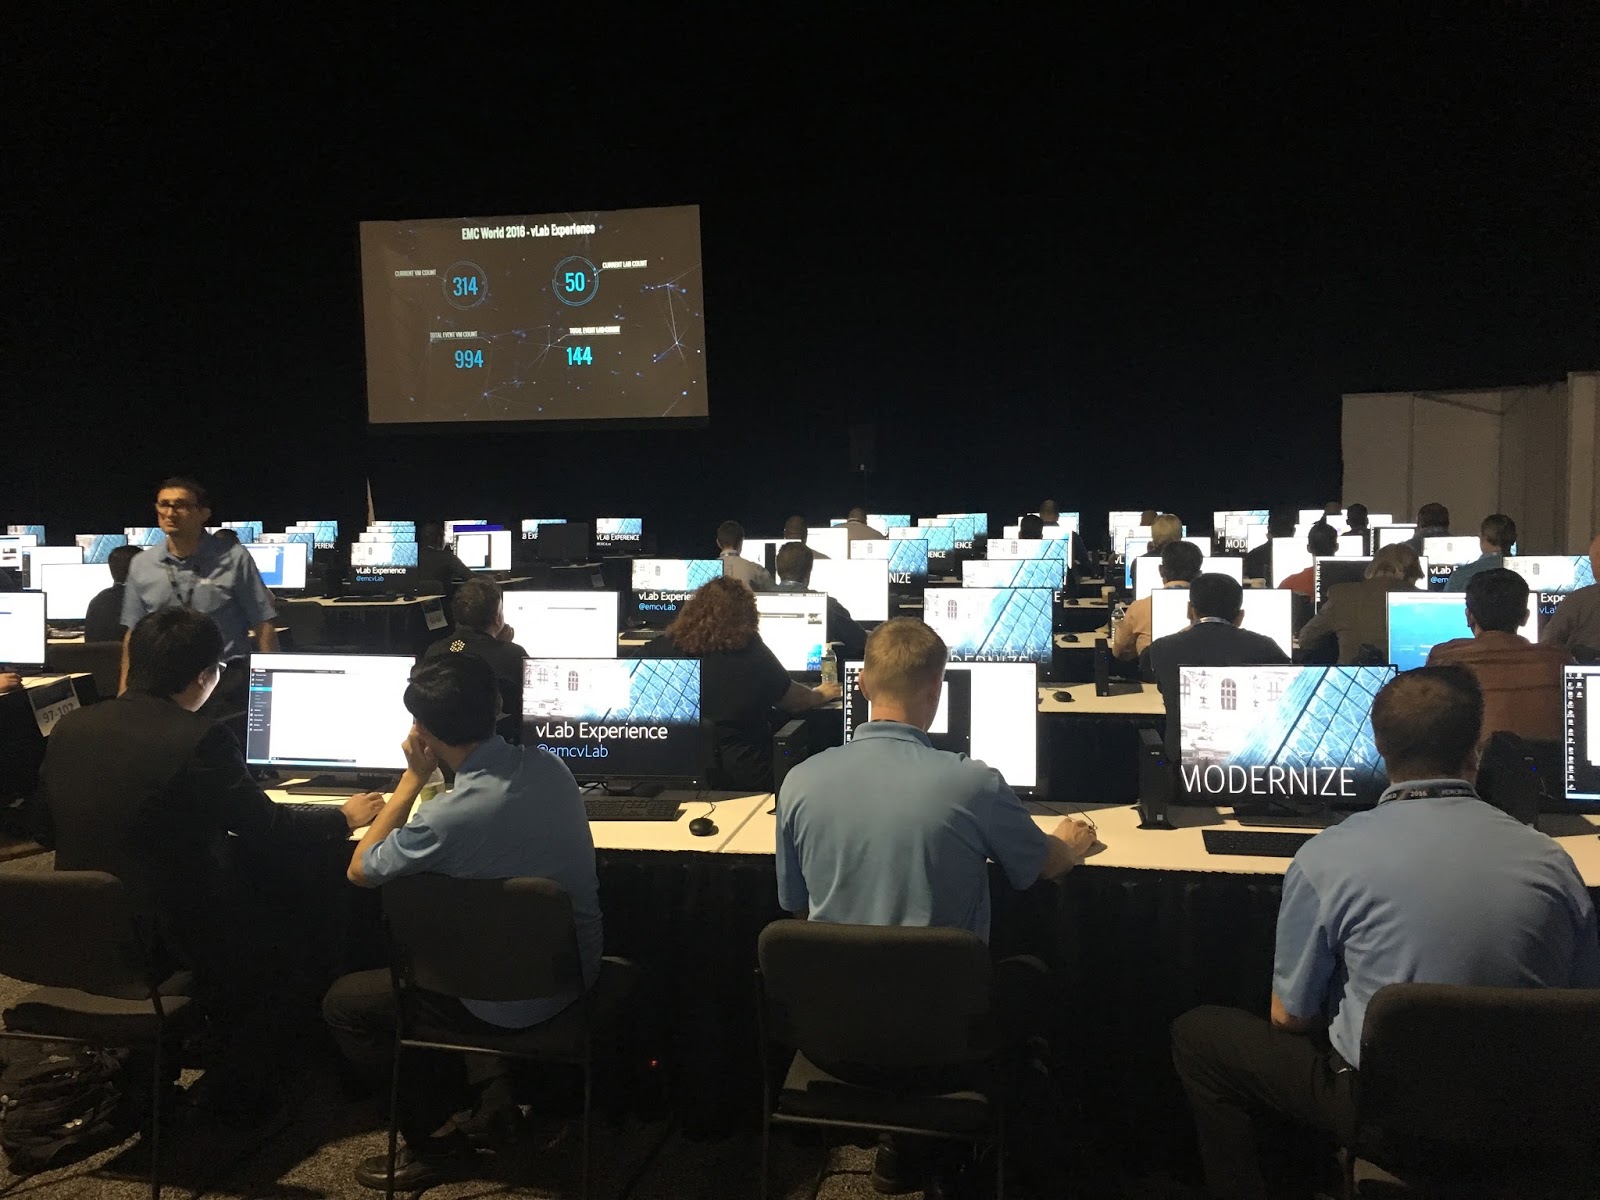
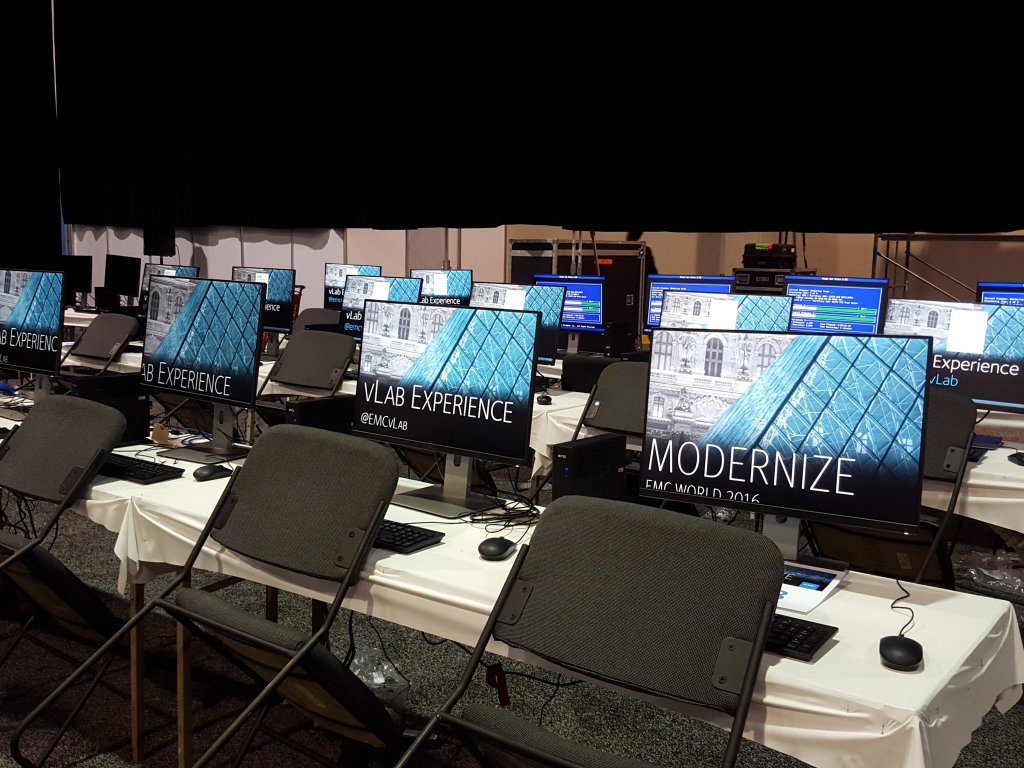
We usually aren’t that busy in the latter half of the show but today has surprised us. We were totally full on the main floor and had to open all three Guided vLab rooms to students. At peak, we were serving up right around 200 labs. This is certainly the busiest we’ve been this year! I’m going to use this post to go through a little of what makes vLab tick under the covers. How is it that we support such a large event?

vLab relies on the capabilities of XtremeIO, Cisco UCS, VMware vSphere, vCloud Director, and custom software. I will walk through the stack from the bottom up…
The underlying hardware starts with a 6x40TB XtremeIO cluster. That is hosted in EMC’s facility in Durham, NC. The array has amazing capabilities and truthfully, it is not overly taxed during the show. We also run a fair amount of additional compute capacity off the same array during the other 51 weeks of the year. It’s actually busiest when we run our unmaps, and we’ve only had to do that once (the night before the show started).
On top of the XtremeIO, we run Cisco B240 servers, most with 512GB of RAM each. There are a few at 256GB RAM and we use those for content that is CPU, rather than RAM, intensive. We are leveraging 192 such hosts to support the show. They live in Durham as well and provide the raw horsepower necessary to run the show. 88TB of RAM seems like a lot but with some labs checking in at over 200GB RAM each, it gets burned through fairly quickly.
We run a mix of vSphere 5.1 and 5.5 for our hypervisors. The requirements for this layer are driven by the content. Many of the Virtual Storage Appliances we run have specifics needs that lock us into one version or another of ESX. Other portions of our infrastructure run 6.0 but not for EMC World this year. On top of ESX, we are running vCD – it handles our orchestration.
We break our capacity into widgets – groups of 32 hosts. Each widget gets divided into two oVDCs / two vCenters and gets its own vCD instance. This may seem like overkill but in addition to the physical resources required to run the labs, we must also provide the automation bandwidth to support provisioning and tearing down potentially hundreds of vApps per hour. In fact, we peaked at around 700 vApp provisioning / deprovisioning actions / hour. Multiply that by and average of 6 VMs / vApp and we’re performing 4200 VM provisions / deprovisions per hour at peak. More than 1 VM / second for you math geeks!
Here’s a basic picture:
Couple notes on this picture… it refers to CEC-D which stands for Common Engineering Cloud – Dynamic. This is an internal service – self service VM provisioning for EMC engineers. Like vLab, it is engineered / supported by my team and runs on the same stack as vLab. Also, we are leveraging NSX within CEC but are not yet using it within vLab.
Over the top of all this hardware and virtualization stands our vLab application. Our application provides the user experience of vLab, lab scheduling / assignment, lab queue management, and interfaces with the APIs of both vCD and vC to control all the orchestration we need.
Starting from the layer closest to the virtualization… the vLab application divides our total population of widgets into cloud segments. These segments provide a logical grouping of our capacity and provide buckets that we can fail between should something happen. This is our “Plan B” for the show should something go wrong in the cloud segment we are using. We have many of the labs pre-staged in another cloud segment and can fail over to that segment should something go wrong in our primary capacity.
For each cloud segment we have a “backend” application that ties directly to the vC and vCD APIs. It is also this layer that controls the queueing we use to provide the pre-population of labs within vLab. This allows us to have a vApp ready for a student when s/he sits down in vLab rather than having to wait for provisioning. Once a student chooses a lab, it is assigned to her and the backend spins up another vApp to refill the queue. This isolates the time / processing it takes to bring the lab into being. Above the backend stand the adapter and consumer layers. These components bring together multiple cloud segments and expose them to the upper UX layer.
The UX of vLab consists of a few major components. HOLA (Hands on Labs Application) is the main interface that is in play for EMC World. We also have a standard portal that’s available for EMC and Partner SEs to provide sales demos to customers. There are additional admin interfaces for managing events and user sessions. HOLA is fully configurable to include the specific labs intended for an event. The user is presented with a series of labs and is able to choose one to run through. It is a fairly clean interface and allows the user to review vLab’s whole catalog of offerings.

Categories of labs are down the left side and are essentially filters on the main catalog. It allows a student to zero in on a topic / lab of interest. We also show a bit of social media and other items of interest. The general purpose is to get the student to select a lab and get into it as quickly as possible. Once the user selects a lab, the consumer / adapter layer makes a request to the backend for a session (which is in reality a vApp designation and duration of the request, for example, a Unity lab for 2 hours). The backend receives the request and assigns a running deployment of that lab to the session request. This is then passed back up to the UX and the user is connected via RDP into their session. If no deployment of the lab is available (pre-pops are exhausted), the backend spins up a new vApp and assigns it to the session request. Our goal is to avoid that completely for EMC World and so far we have been 100% successful. We don’t want students to wait!
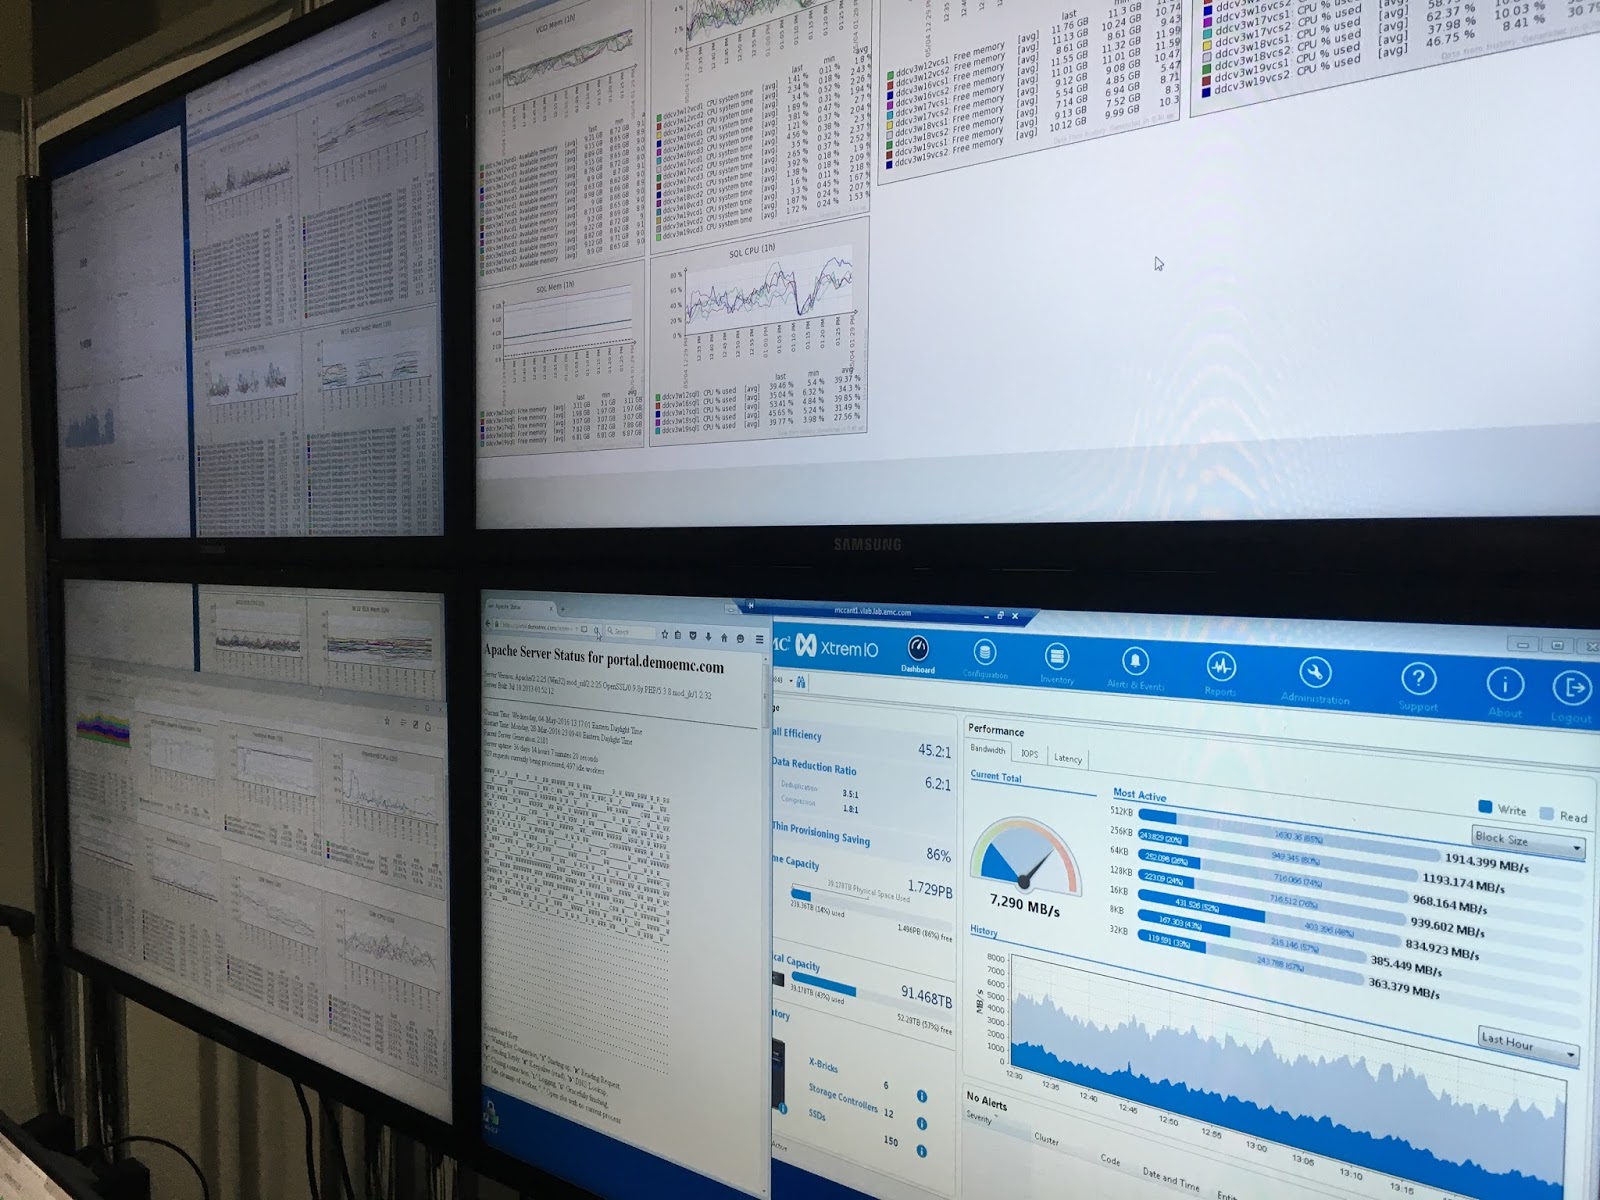
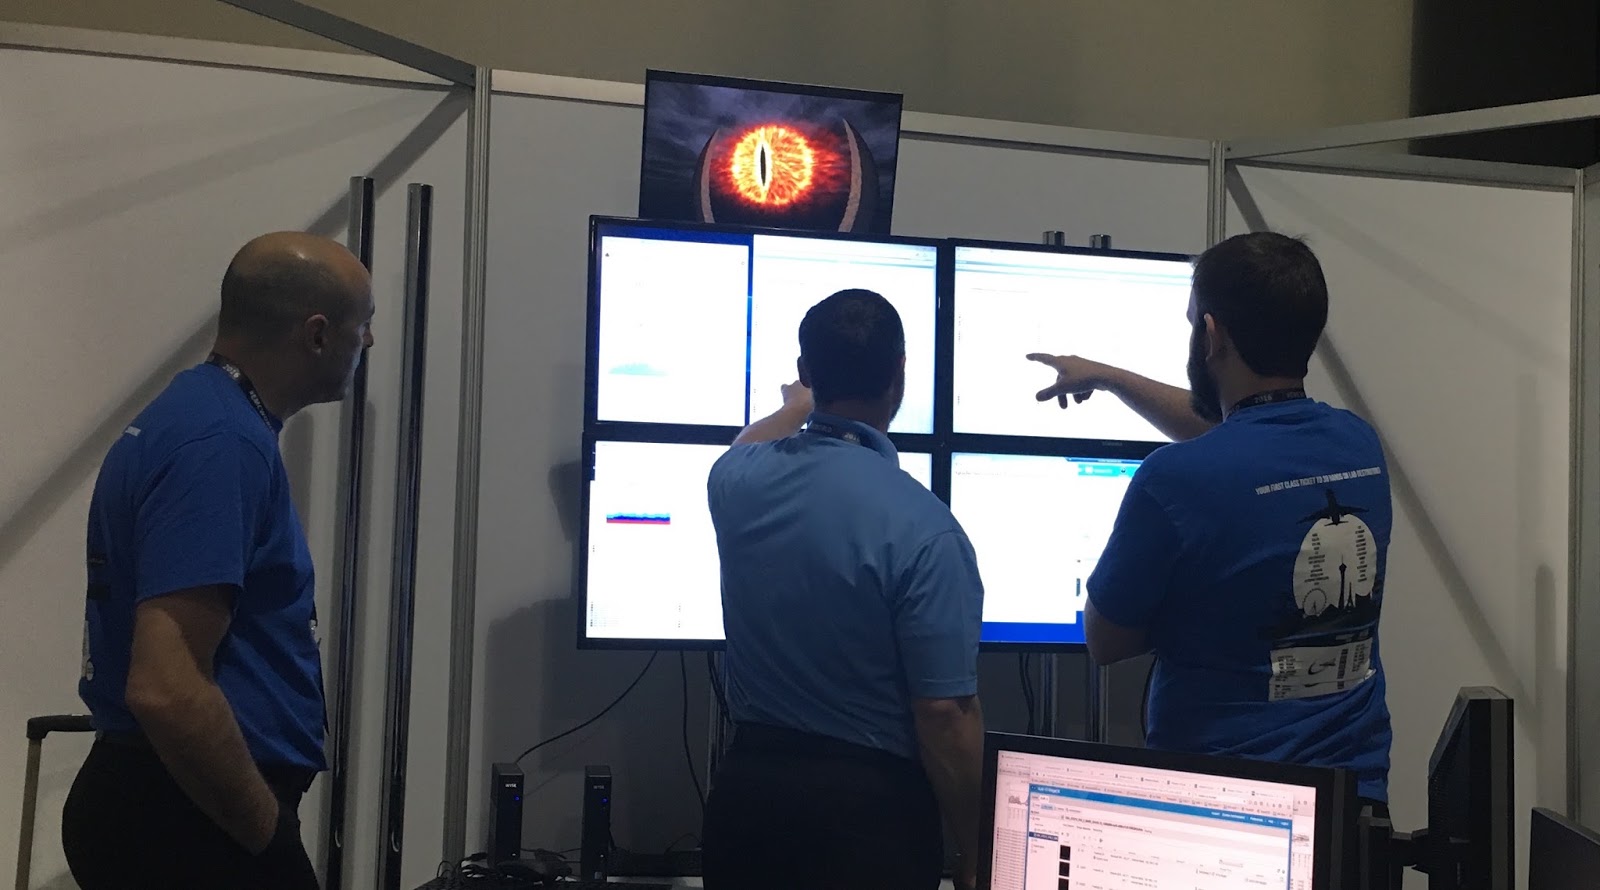
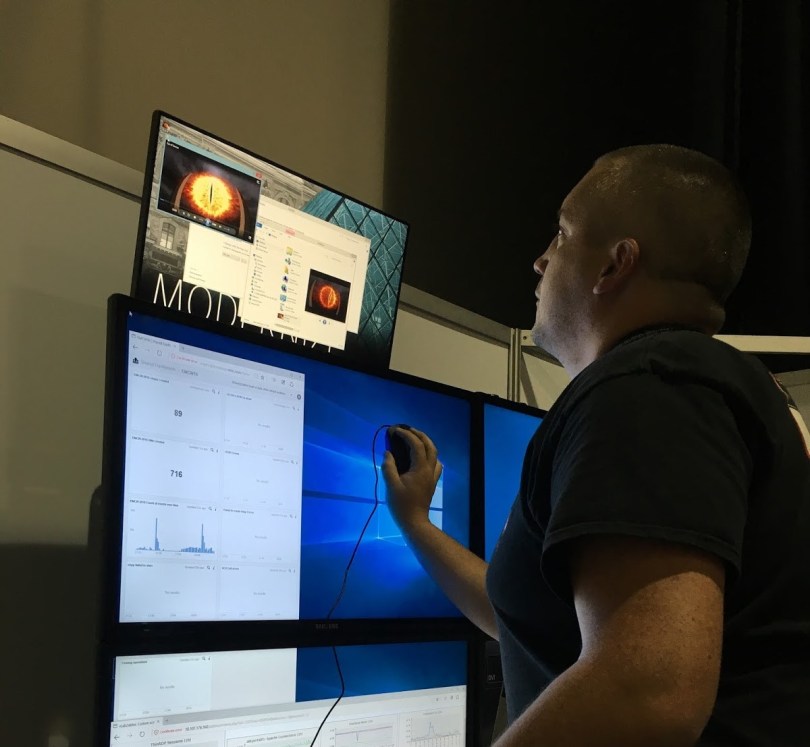
We watch the entire stack with the Eye of Sauron, Zabbix, and the proprietary tools that accompany each component. We monitor physical resources across all of our capacity as well as the resources consumed by every vC, vCD, and our application. These resources are normally leading indicators of issues that will reveal themselves as performance problems on the show floor. We also watch various other application components – internal queues, web service connections, RDP connections. It all looks like this:
Thats a quick overview of how vLab does what it does – thanks for reading!


